
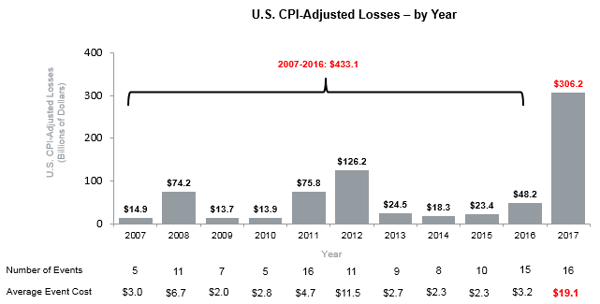
The severity of natural disasters reached a record $306B in 2017, with the average CAT event rising to $19.1B. Due to this increase, cycle times (the claim life cycle) have been severely affected across the industry, placing a strain on customer satisfaction levels.
CAT Severity and Cycle Time Increase, but Insurers Can Still Attain High Customer Satisfaction
The severity of natural disasters reached a record $306B in 2017, with the average CAT event rising to $19.1B. Due to this increase, cycle times (the claim life cycle) have been severely affected across the industry, placing a strain on customer satisfaction levels. However, not all carriers have been equally affected. Carriers that have been the most proactive in communicating and managing customer expectations have been able to mitigate the risk of lower satisfaction triggered by these CAT events.
2017 Experienced the Highest Severity Losses from Natural Disasters
The average CAT total direct event cost (insured loss + uninsured loss) in 2017 increased nearly six times from the prior year (to $19.1B from $3.2B in 2016). This was calculated by taking the CPI-Adjusted Losses and dividing by the number of CAT events experienced during the year. The total CPI-Adjusted Losses for 2017 alone were more than 70% of the total CPI-Adjusted Losses from all years in the previous decade (2007-2016) combined. The $306.2B in CPI-Adjusted Losses in 2017 is rivaled only by the $214.8B in CPI-Adjusted Losses in 2005 due to four hurricanes, including Hurricane Katrina.
 Source: NOAA NCEI U.S. Billion-Dollar Weather and Climate Disasters (2018). https://www.ncdc.noaa.gov/billions/summary-stats
Note: Hurricane Maria is included in the 2017 data.
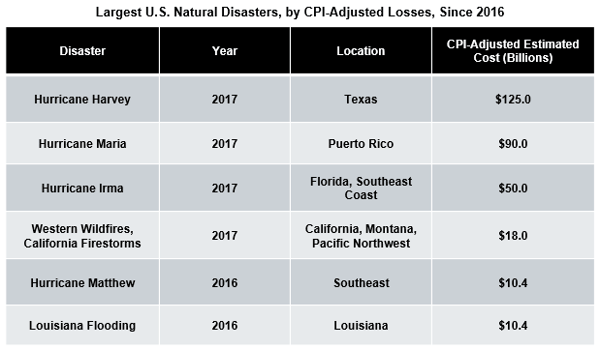
During the past two years, there were six storms that each had a CPI-Adjusted estimated loss of $10B or more. This is 40% of the total number of $10B+ loss events that have occurred since 2007. Four of these large-loss natural disasters occurred in 2017, adding an extra burden to the already escalated number of events that occurred in recent years. Hurricane Ike (2008), Hurricane Irene (2011), the U.S. drought (2012), and Hurricane Sandy (2012) were the main drivers of catastrophic event losses prior to 2016.
 Source: NOAA NCEI U.S. Billion-Dollar Weather and Climate Disasters (2018). https://www.ncdc.noaa.gov/billions/events
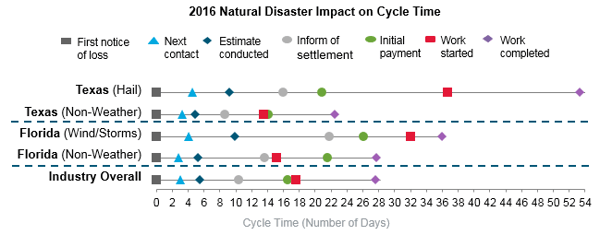
Natural Disasters Typically Lead to Longer Cycle Times and Lower Customer Satisfaction
The significant impacts of CATs during the past few years have put a substantial strain on the industry to adequately address these losses. More claims lead to strained resources and ultimately result in slower cycle times during the claims process. The J.D. Power 2018 U.S. Property Claims Satisfaction (PCS) StudySM provides insights as to how property claim cycle times can be affected by catastrophic events.
This study was fielded from January 2017 through November 2017. Study respondents filed and settled claims between January 2016 and November 2017. Given the study time frame, only a portion of the claims for events occurring in the second half of 2017 (such as Hurricane Harvey in August and Hurricane Irma in September) are represented in the 2018 study, with more data available for 2016 events than for 2017 events. Two examples of natural disasters highlighted in the 2018 study include Hurricane Matthew (October 2016) and hail storms that affected the Texas region (April 2016). In analyzing these two examples, it is easy to see how natural disasters can have an impact on both cycle time and customer satisfaction.
During a natural disaster, when insurers’ resources are stretched thin, it is important to be aware of delays in the claim process that can have a negative impact on the cycle time. The claim cycle times in both Texas (hail-related) and Florida (wind/storms-related) were much higher than for non-weather-related claims in the same regions. Estimation times nearly doubled in both natural disaster scenarios compared to claims for non-weather-related events. A delay in the estimation process causes delays in other important processes, including the settlement decision and payment.
 Source: J.D. Power 2018 U.S. Property Claims Satisfaction (PCS) StudySM
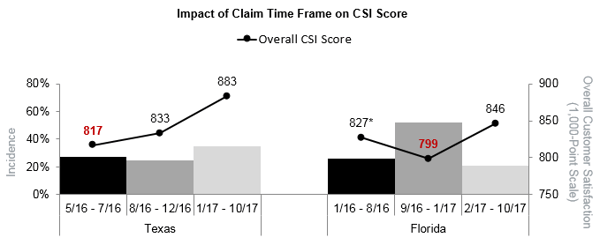
Customer satisfaction was lower in Texas for claims filed in the months immediately after the hail storms in that region. In addition, claims that were filed in Florida around the time of Hurricane Matthew resulted in lower customer satisfaction scores. In both cases, satisfaction was lower in the time frame that claims for these disasters were being handled. This was partly driven by a one-week increase in the amount of time it took to inform customers of their settlement after these catastrophic events. The longer cycle times then contributed to lower overall customer satisfaction for claims related to these events.
 Source: J.D. Power 2018 U.S. Property Claims Satisfaction (PCS) StudySM
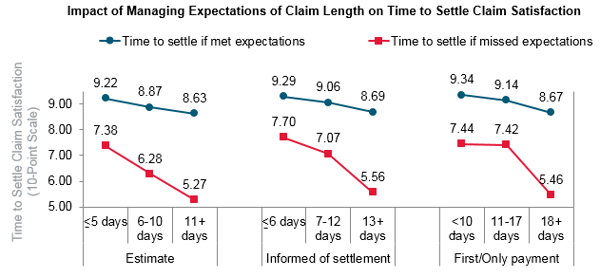
Setting Expectations is Key to Customer Satisfaction in the Face of Long Cycle Times
How can insurers mitigate the risk surrounding cycle time increases? The 2018 PCS Study findings show that although longer cycle times can lead to lower customer satisfaction, managing claimant-perceived expectations of the claim length can help improve satisfaction scores, even when the cycle time is longer. An analysis of ratings for the Key Performance Indicator (KPI) to provide initial/only payment within 10 days shows that customer satisfaction is much higher when those expectations are managed properly. For example, if the initial/only payment occurs between 11-17 days, and this timing missed the claimant’s expectations of 10 days or less, satisfaction with the time to settle the claim drops 1.72 points (on a 10-point scale) compared to the same time frame when such expectations are met (7.42 vs 9.14, respectively).
 Source: J.D. Power 2018 U.S. Property Claims Satisfaction (PCS) StudySM
It is important for insurers to have a plan in place to minimize cycle time when there is a natural disaster. It is even more important for them to effectively manage the messaging and communication of realistic time lines to appropriately set claimant expectations regarding timing of key claim process events, which can lead to attaining and maintaining high customer satisfaction.