
As insurers struggle to grow with fewer shoppers and new buyers in the market, developing a retention strategy based on demonstrating value through the customer experience will help improve the bottom line and potentially lead to an increase in referrals.
Customer satisfaction with the auto insurance experience has increased for a second consecutive year.1 This is a positive sign for insurers with strong retention strategies, given that J.D. Power research shows an increase in customer satisfaction has a corresponding decline in the intent to shop for a different auto insurer. Furthermore, there is a measurable relationship between an increase in customer satisfaction and a decline in actual shopping rates.2
As insurers struggle to grow with fewer shoppers and new buyers in the market, developing a retention strategy based on demonstrating value through the customer experience—outside of price alone—will help improve the bottom line and potentially lead to an increase in referrals.
Effectiveness of Digital Communication Becoming Increasingly Important
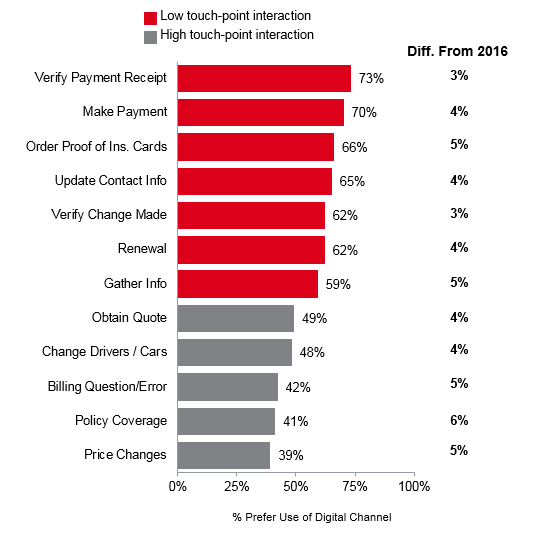
Development of an auto insurance retention strategy should take in to account the most important factor in driving customer satisfaction, which is non-claim interaction. Improvements in this aspect of the customer experience have helped to fuel this year’s gain in auto insurance satisfaction; however, continued success in this area will largely be determined by insurers’ ability to evolve as the demand for availability of digital channels continues to grow. Customers’ preferences for interacting with their insurer via digital channels (e.g., website, email, online chat, social media, text message, or mobile app) have increased significantly since 2016, regardless of the reason for interaction. In particular, customers more strongly prefer to use digital channels for low touch-point/less complex reasons, compared to high touch-point/more complex reasons for interacting. While younger customers demonstrate a stronger preference for the use of digital channels, the desire for an increased use of digital mediums is seen across all generational cohorts.
Figure 1: Preference for Digital Interaction Channel by
Reason for Contact1
Opportunity Exists for Improved Online-Only Interaction
Despite an increase in satisfaction this year with interaction via their auto insurer’s website and assisted online (chat) experience, there is still opportunity for insurers to better meet the needs and expectations of customers who rely on digital methods of interaction. Customers across various types of insurance are most satisfied when they interact with their insurer via a mix of online and offline channels, compared to online only or offline only. Auto and homeowners insurance customers interacting through online-only or offline-only methods are equally satisfied with both methods, whereas among renters and life insurance customers, offline-only users are more satisfied than are their online-only counterparts. Until insurers demonstrate the ability to fully satisfy customers who rely solely on online channels for interaction, supplementing online touch-points with offline interaction will yield more satisfied customers, and in most cases, also lead to higher levels of advocacy.
Figure 2: Impact of Method of Interaction on
Satisfaction and Advocacy
Insurer Size Correlated with Online-Only Interaction Satisfaction
While a number of factors contribute to how important providing an outstanding digital experience is for an insurer, insurer size (as measured by DPW5) is one such contributor. Customer preference for the use of digital channels to interact with their insurer is correlated with the size of the insurer, as customers of large carriers (DPW $2B+) have a stronger preference for such interaction than their mid-size counterparts (DPW $800 < $2B). Customers of mid-size carriers in turn more strongly prefer use of digital methods than those of small carriers (DPW <$800M). Large carriers, which oftentimes have additional resources to dedicate to developing more sophisticated digital communication processes and tools, are generally doing a better job of providing positive digital interaction experiences to their customers. Overall satisfaction among large carrier customers interacting solely through online channels is slightly higher than among those interacting solely via offline methods. However, the opposite is true among mid-size and small carriers, as satisfaction among those interacting only through offline channels is notably higher than among online-only customers.
Figure 3: Impact of Carrier Size on Overall Auto Satisfaction by Interaction Method1
Figure 4: % Online Interaction 2016-20181
Tailoring Communication Channels to Preferred Methods Increases Satisfaction and Advocacy
A potential future decline in auto insurance shopping rates, as predicted by an increase in auto insurance customer satisfaction, makes retaining current customers critical. While an effective retention strategy can take many shapes, one element not to be overlooked is the importance of enabling customers to interact in their preferred ways.
This is evidenced by looking specifically at auto claims status updating. Satisfaction and NPS® with the claims experience are significantly higher among customers who receive status/progress updates regarding their claim via only their preferred method(s) than among those who receive communication through methods other than only via their preferred methods.6
The demand for use of digital channels of interaction continues to increase, and expectations regarding the effectiveness of digital experiences are on the rise (set by experiences in other industries). Auto insurers that focus on enhancing their digital interaction touch-points and tailoring the use of such touch-points to individual customer preferences will be better positioned to execute on a retention strategy.
Sources
1J.D. Power 2018 Auto Insurance Satisfaction StudySM
2J.D. Power 2018 Insurance Shopping StudySM
3J.D. Power 2017 Home Insurance StudySM
4J.D. Power 2017 Life Insurance StudySM
5Insurer size determined using 2016 DPW data from S&P Global Market Intelligence
6J.D. Power 2017 Auto Claims Satisfaction StudySM
Note: Net Promoter, Net Promoter System, Net Promoter Score, NPS® and the NPS-related emoticons are registered trademarks of Bain & Company, Inc., Fred Reichheld and Satmetrix Systems, Inc.